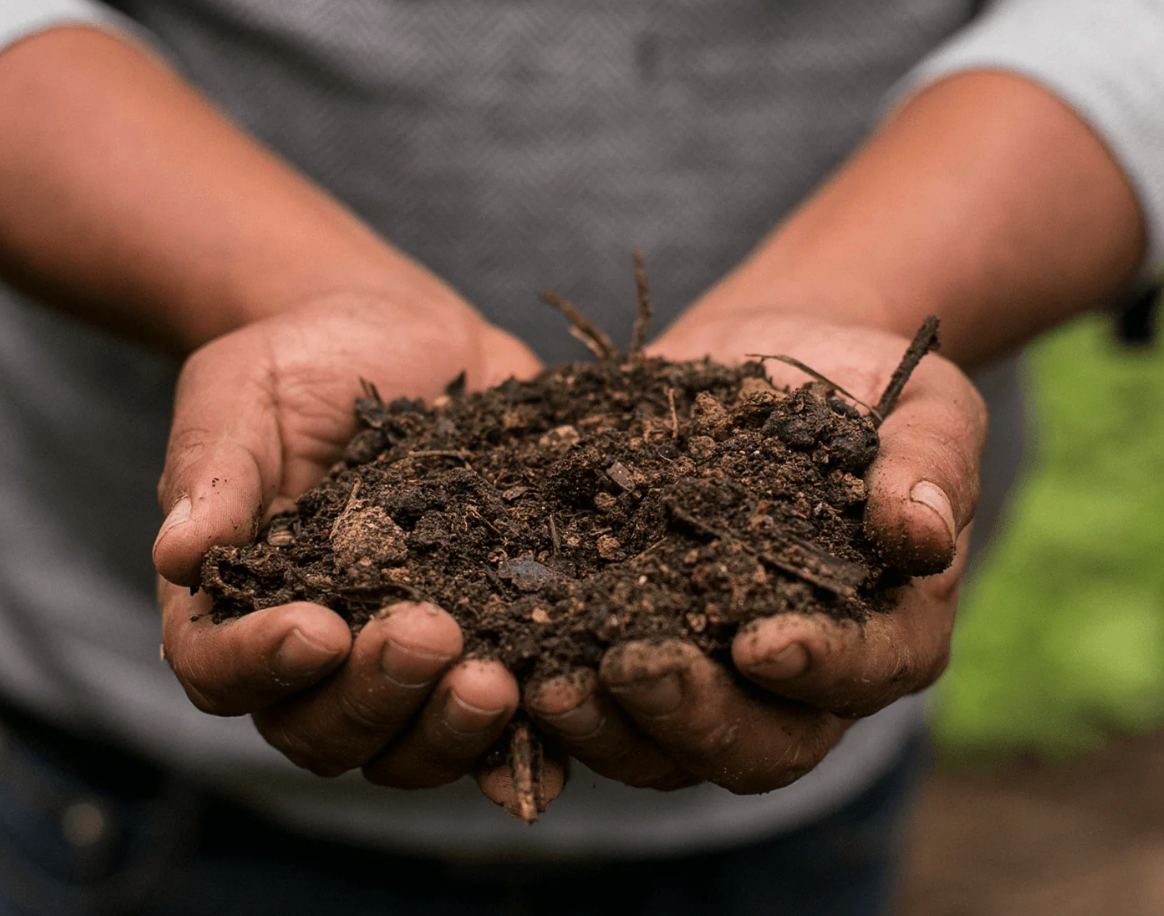
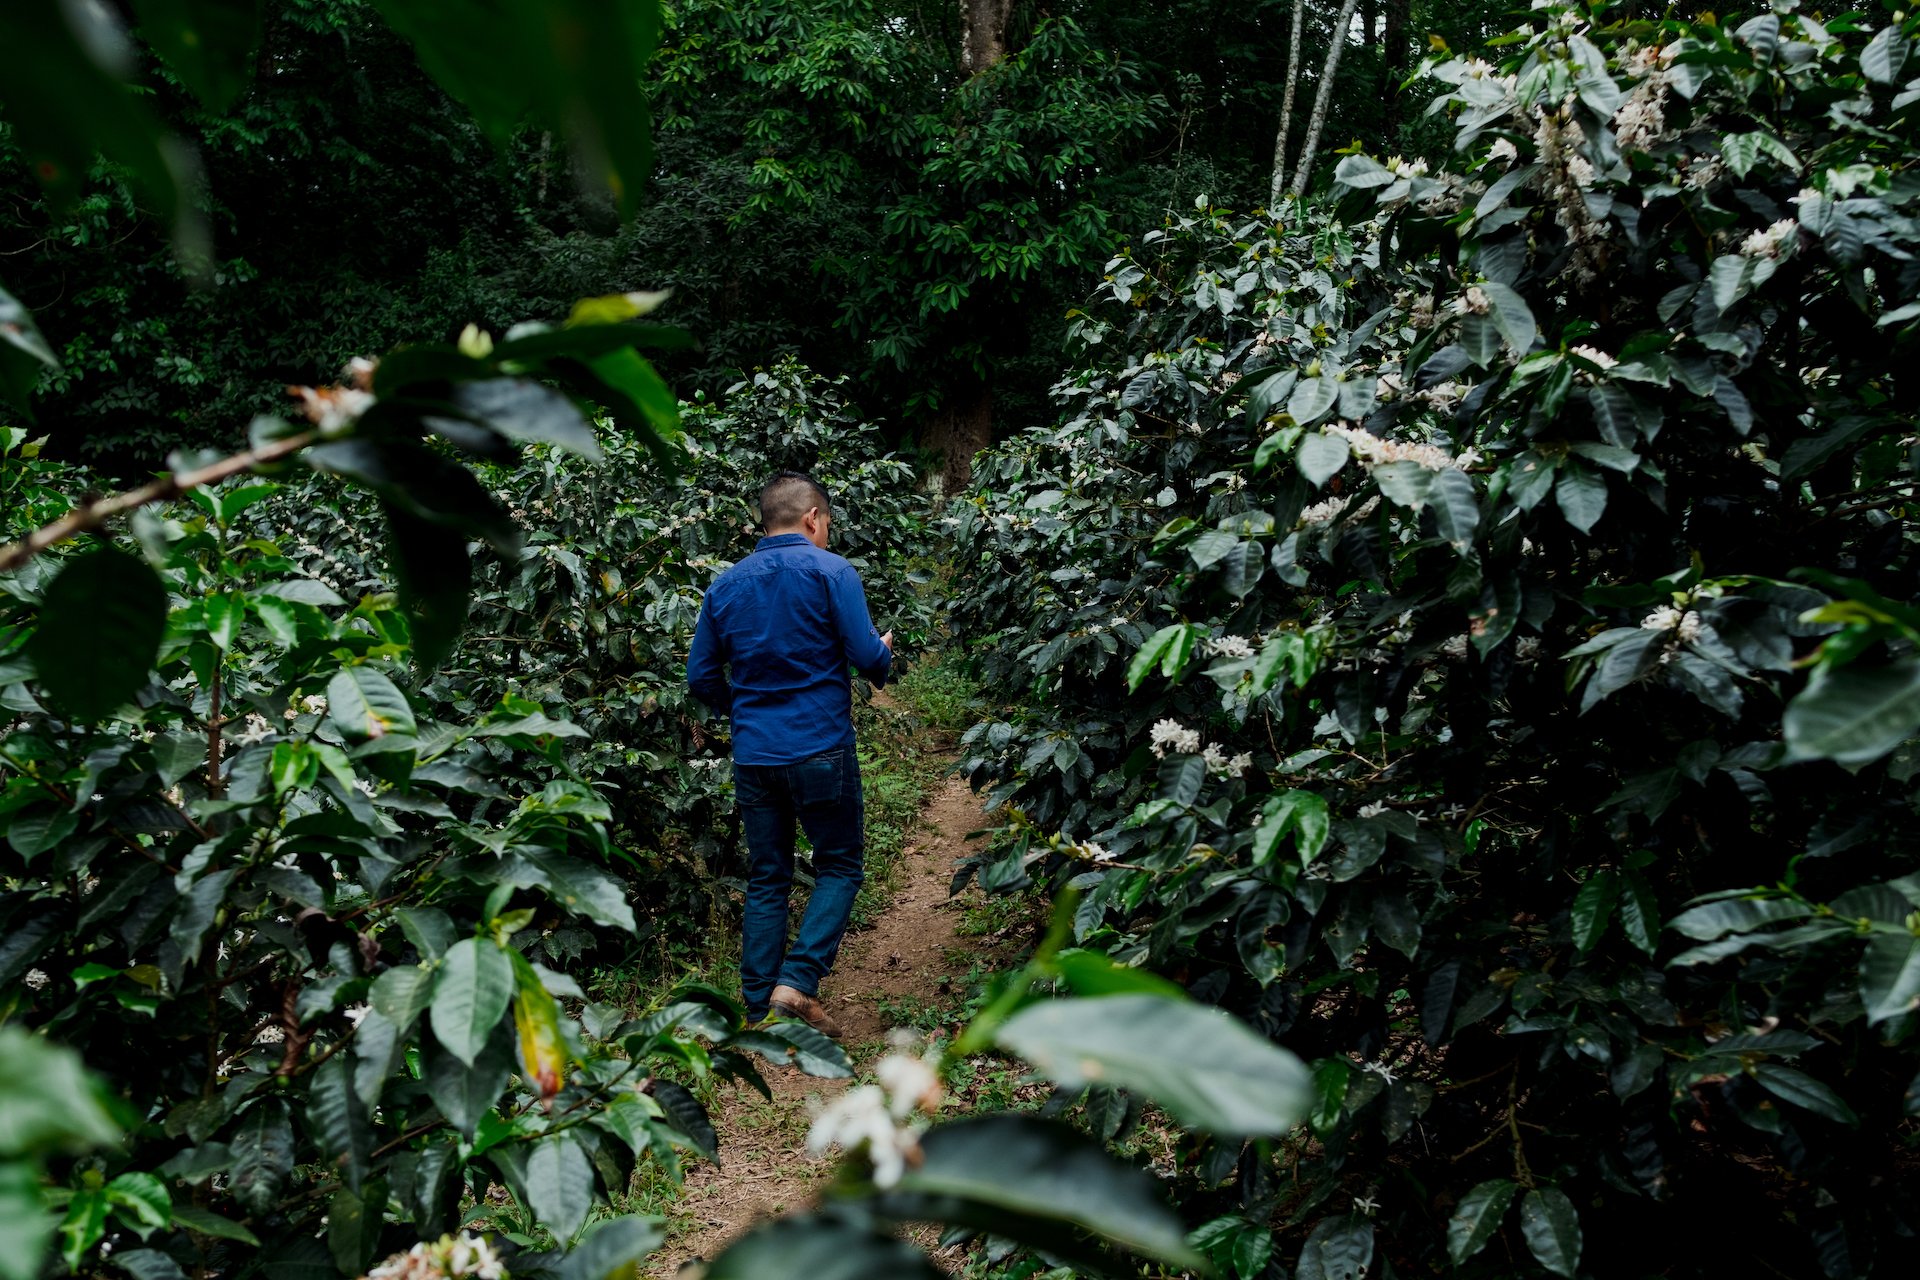
It is generally accepted among coffee professionals that Honduras is the "value origin" of Central America. But we're seeing that change. On a...


It is generally accepted among coffee professionals that Honduras is the "value origin" of Central America. But we're seeing that change. On a...
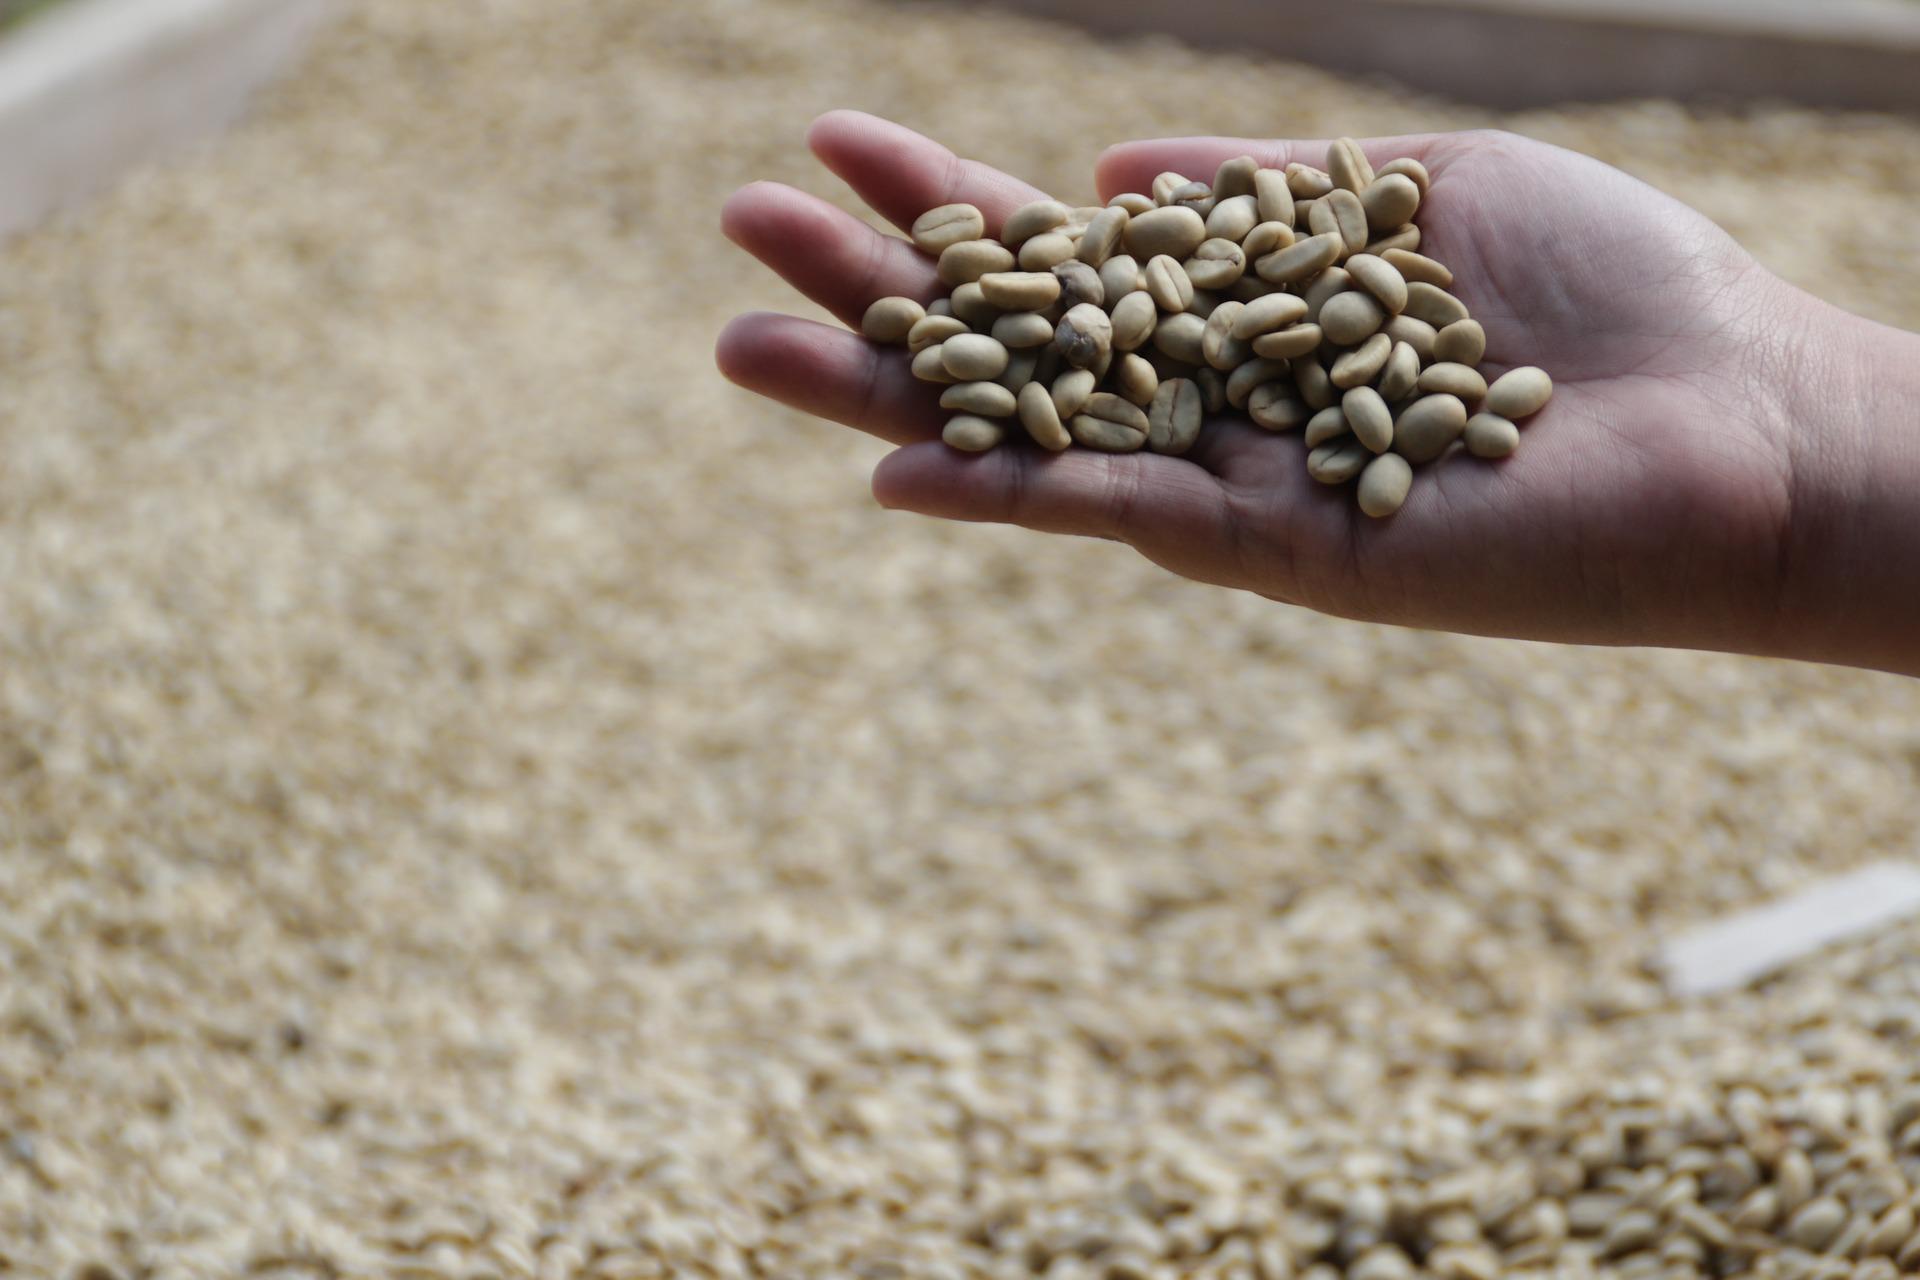
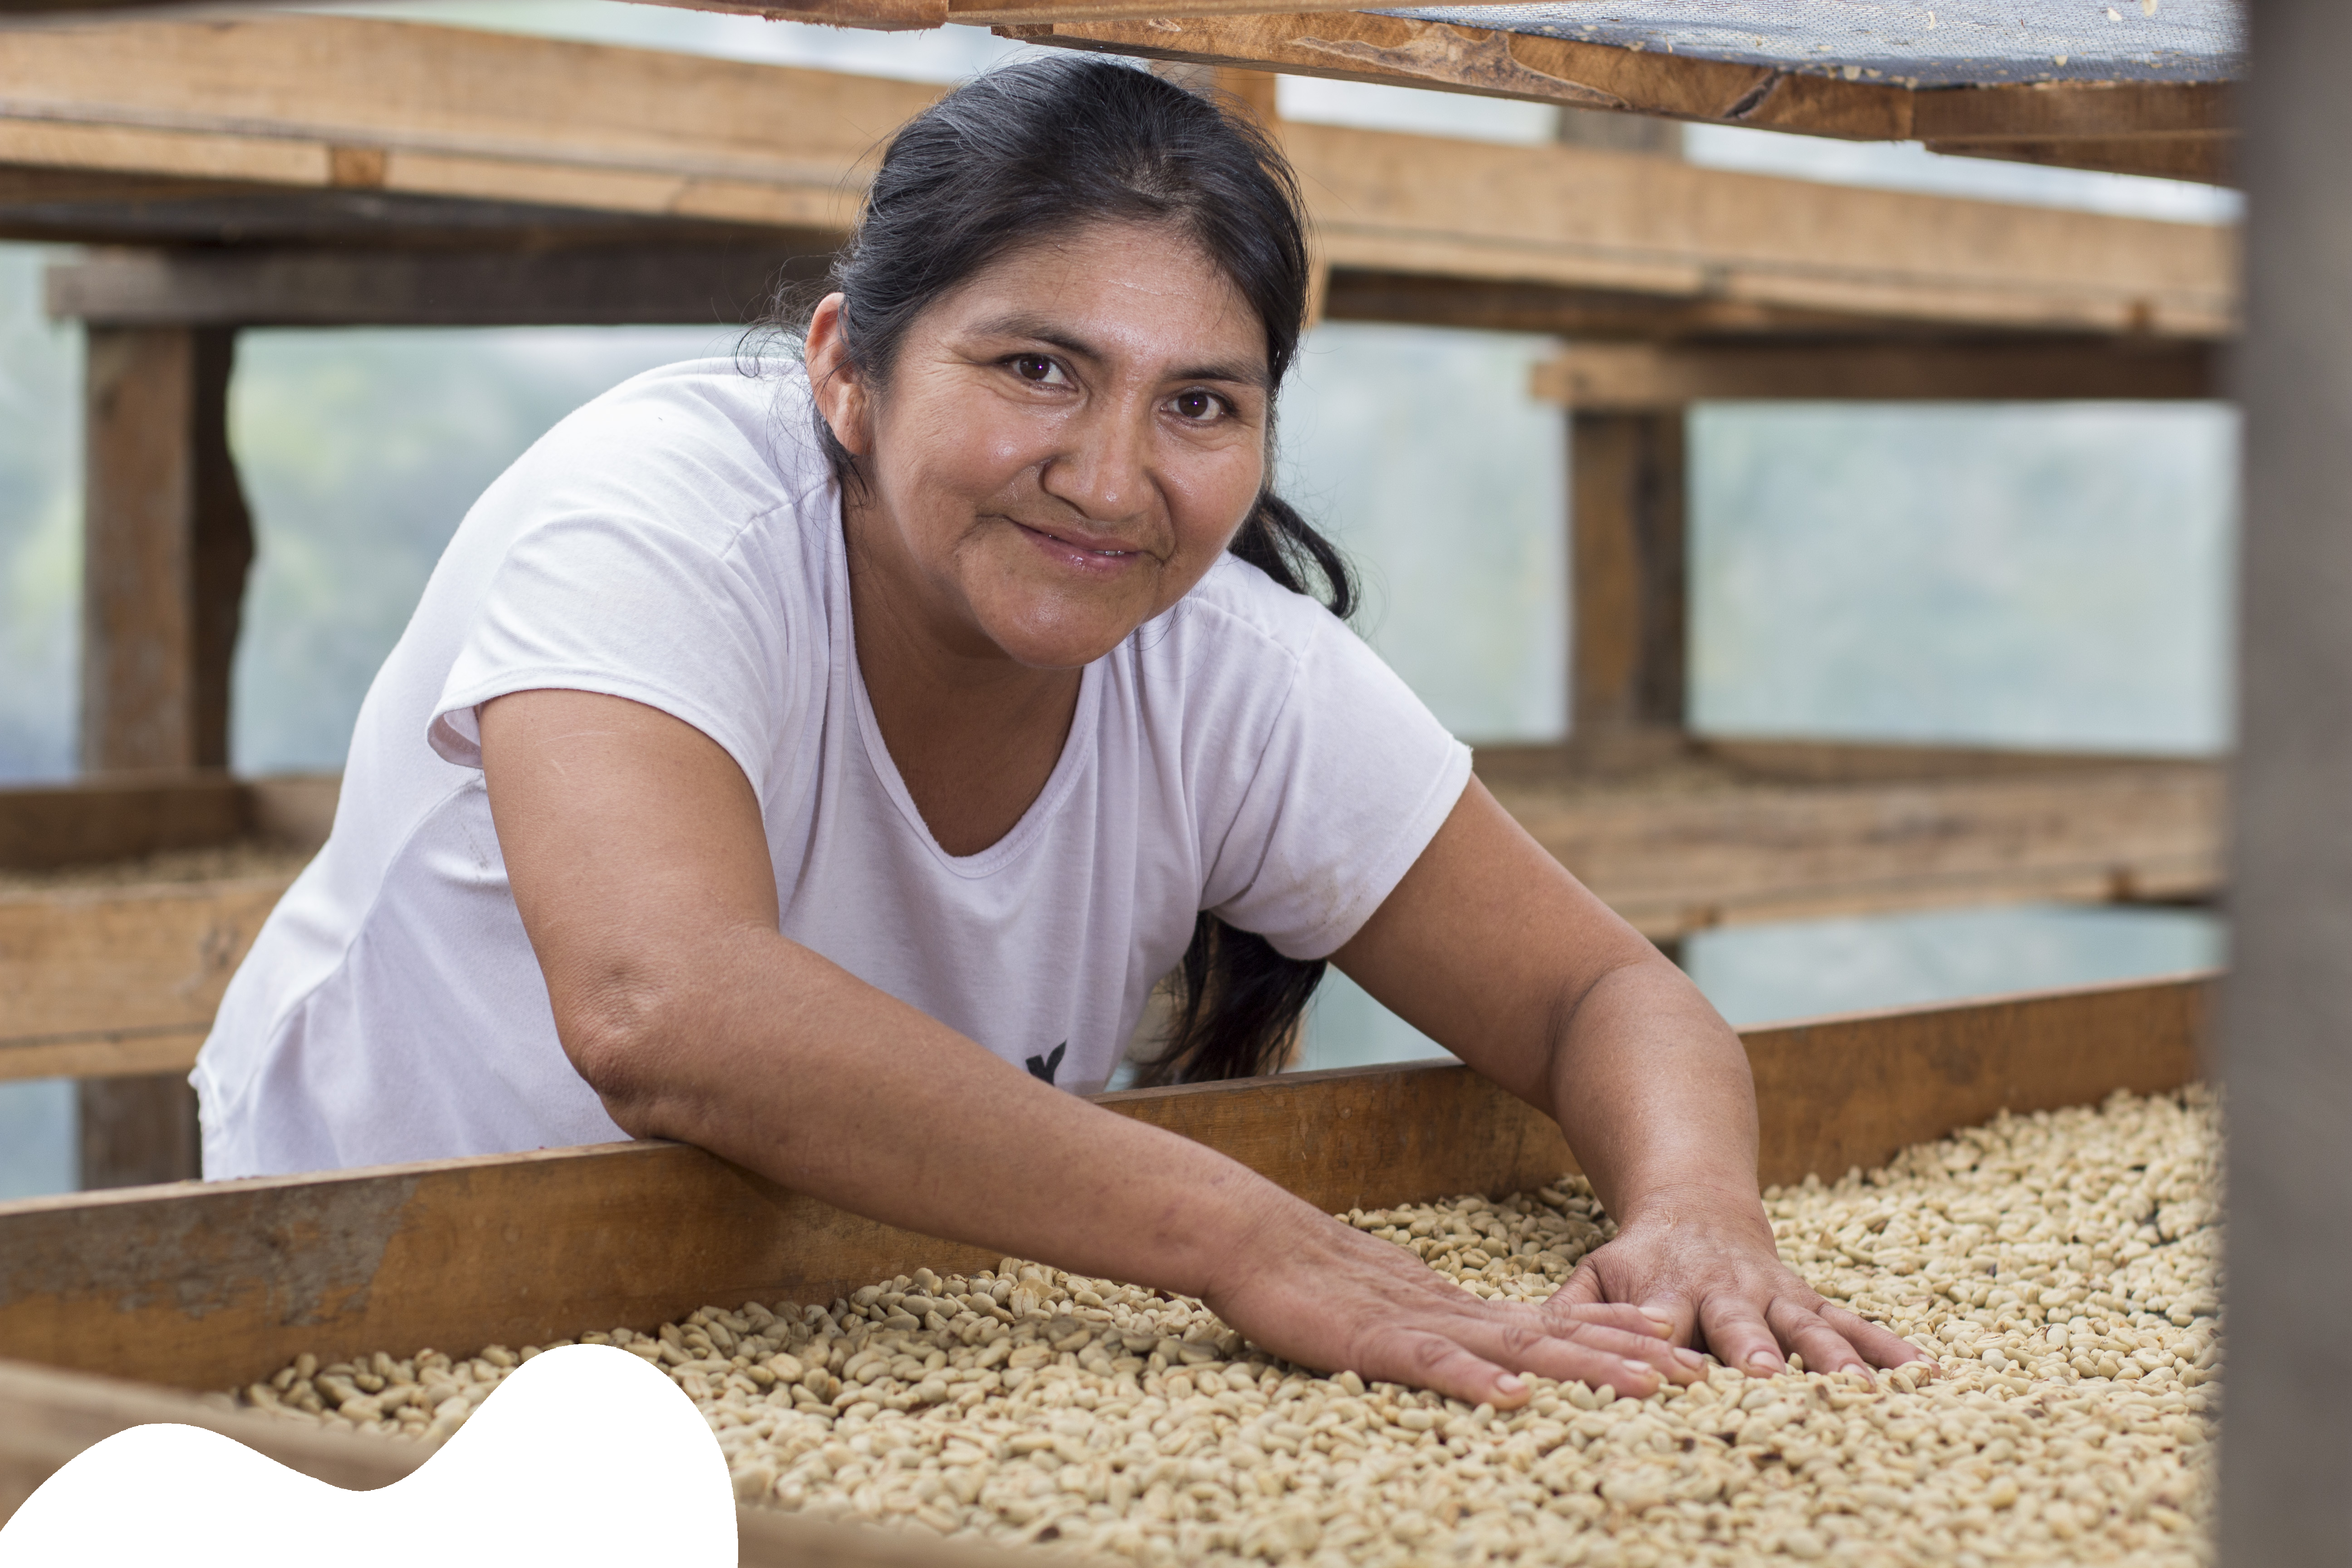
Peru, a hidden gem for many, continues making waves on the world's coffee scene, with its coffee being exported to over 50 countries and an annual...
Peru has emerged as a leading origin in the specialty coffee industry in recent years. Its climatic diversity, process innovation, and valuable...
Today, we will be delving into a topic on the minds of many in recent months: the renowned climatic phenomenon known as El Niño. To help us better...
We had the pleasure of hearing from Lalo Perez, a co-founder of BUNA Mexico, a coffee brand with multiple cafes in Mexico City, a roastery, and an...
A few days ago, on March 30th, the organization Fairtrade International made a big announcement. They will be raising the minimum price for FT...
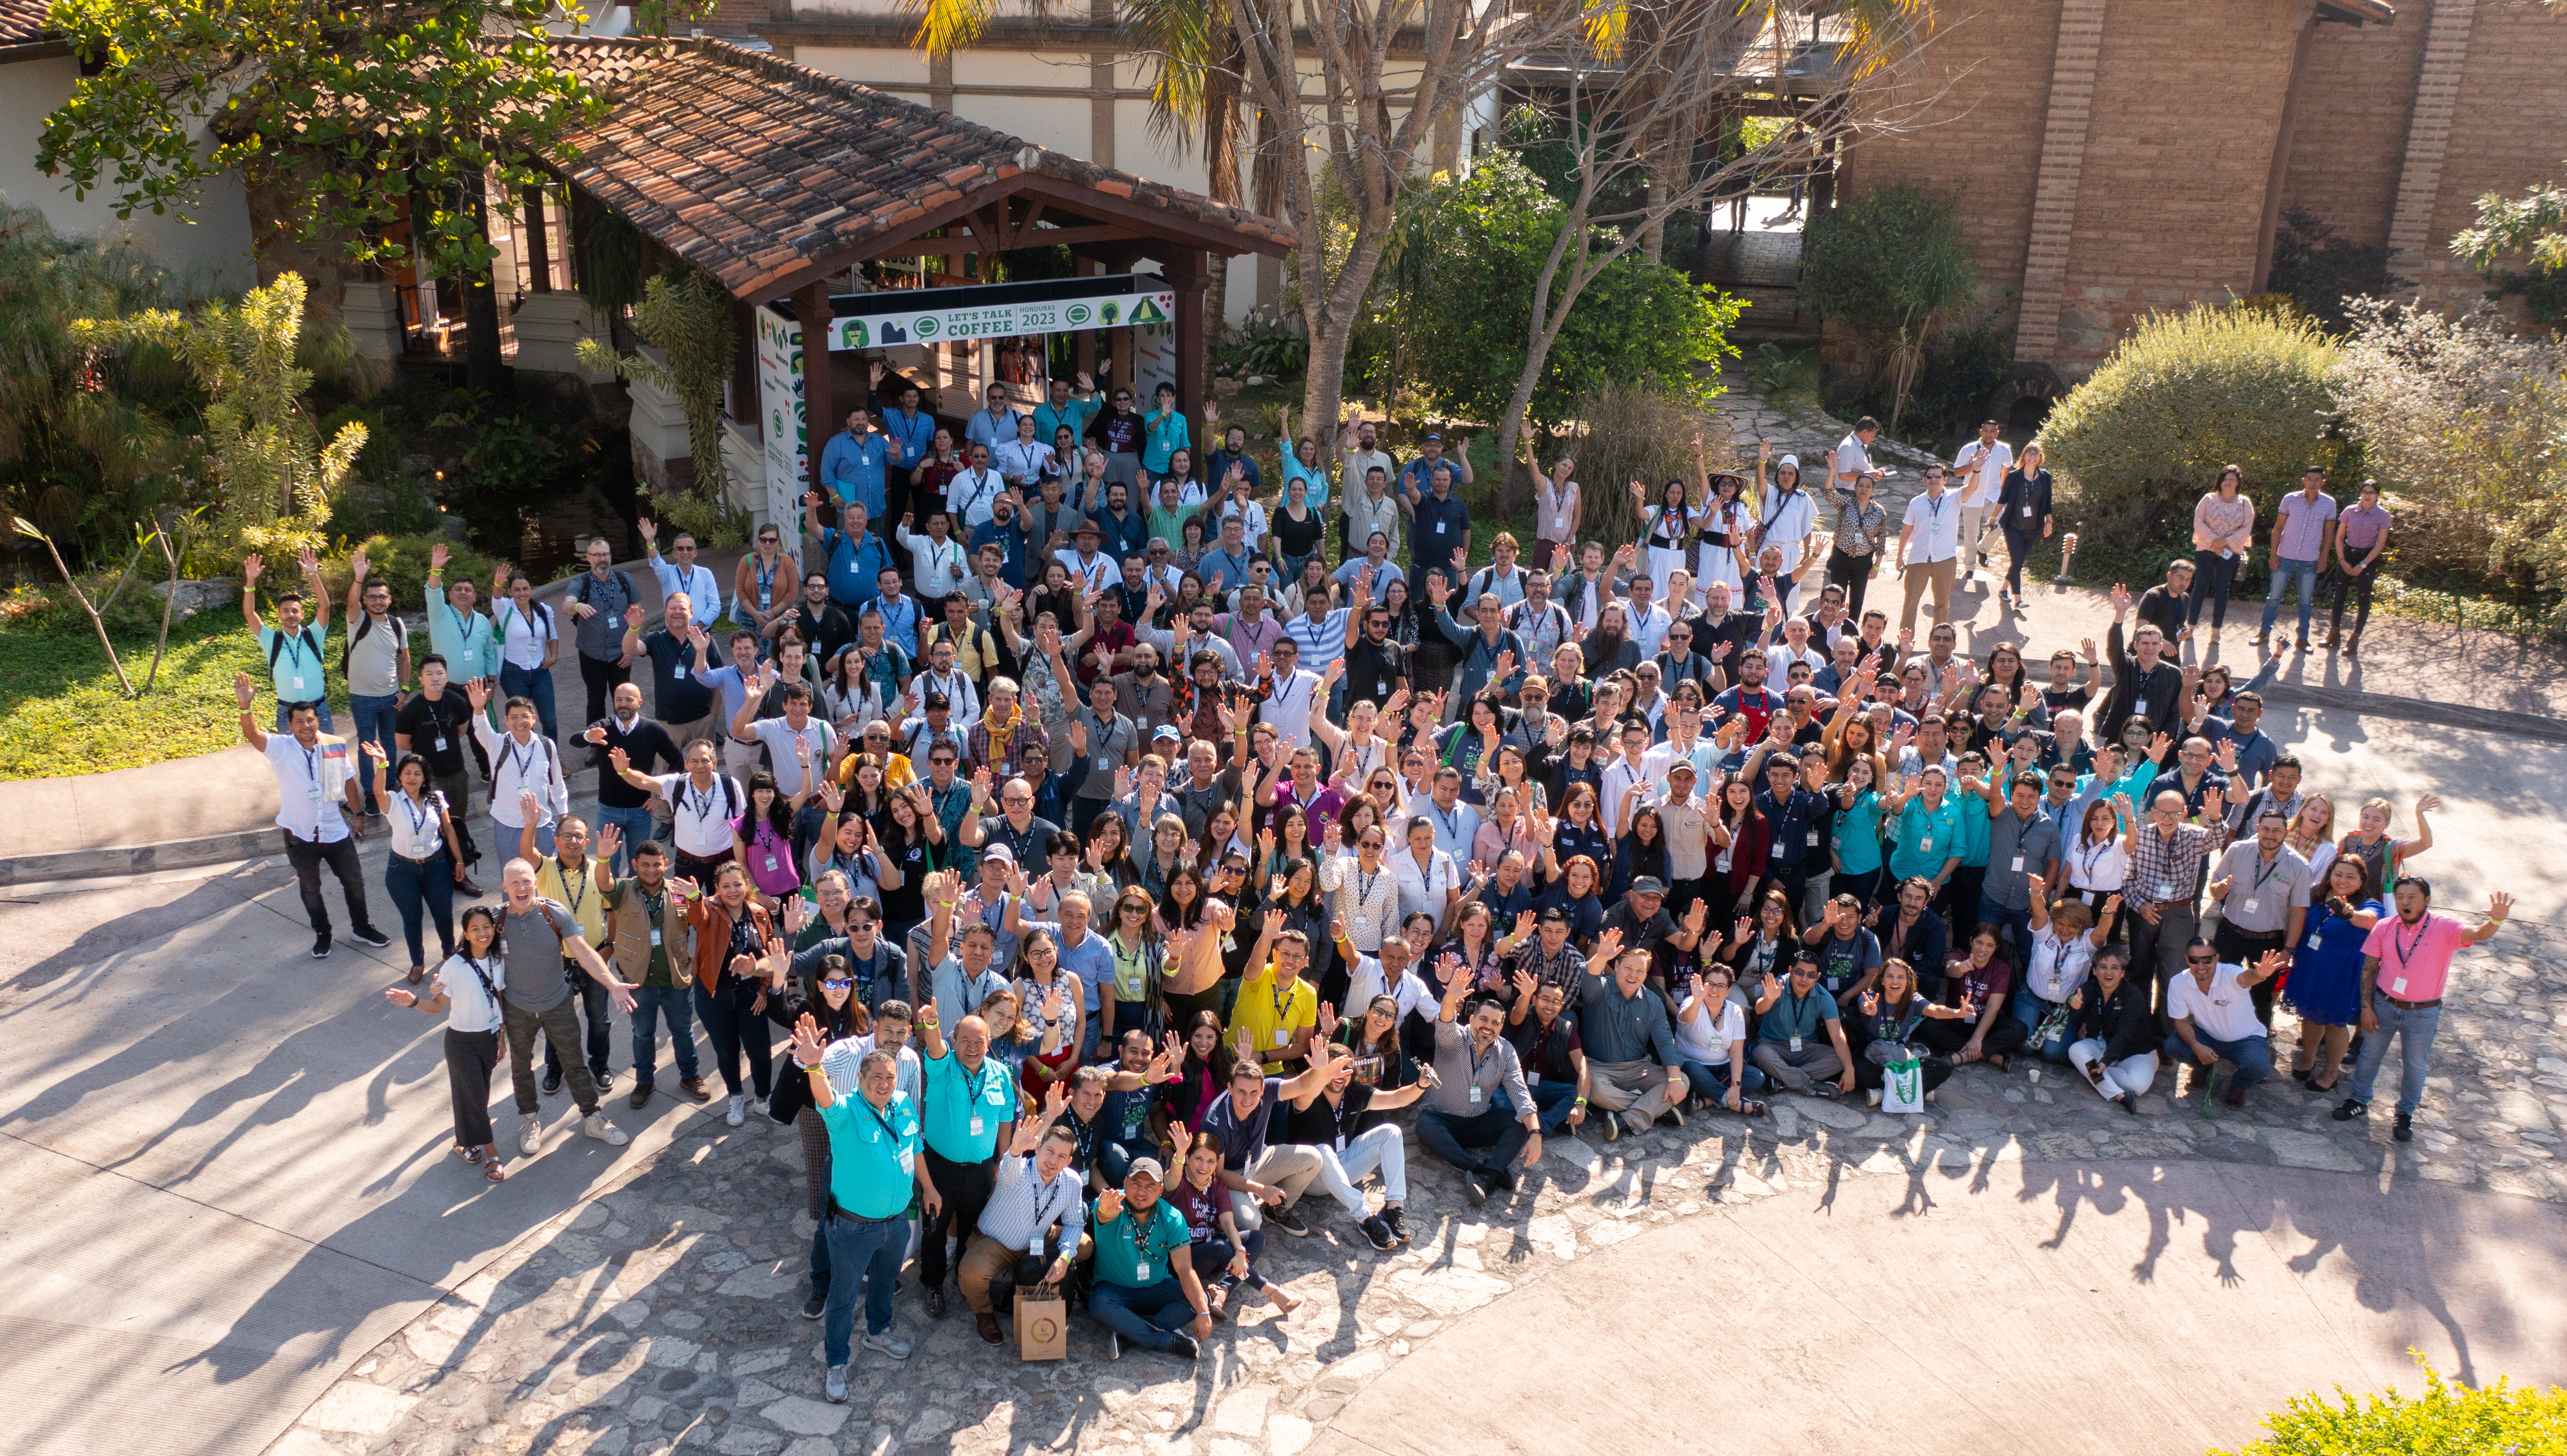
Let's Talk Coffee® 2023 has ended, and what an incredible event it was! For three days, more than 350 coffee professionals from 26 countries...
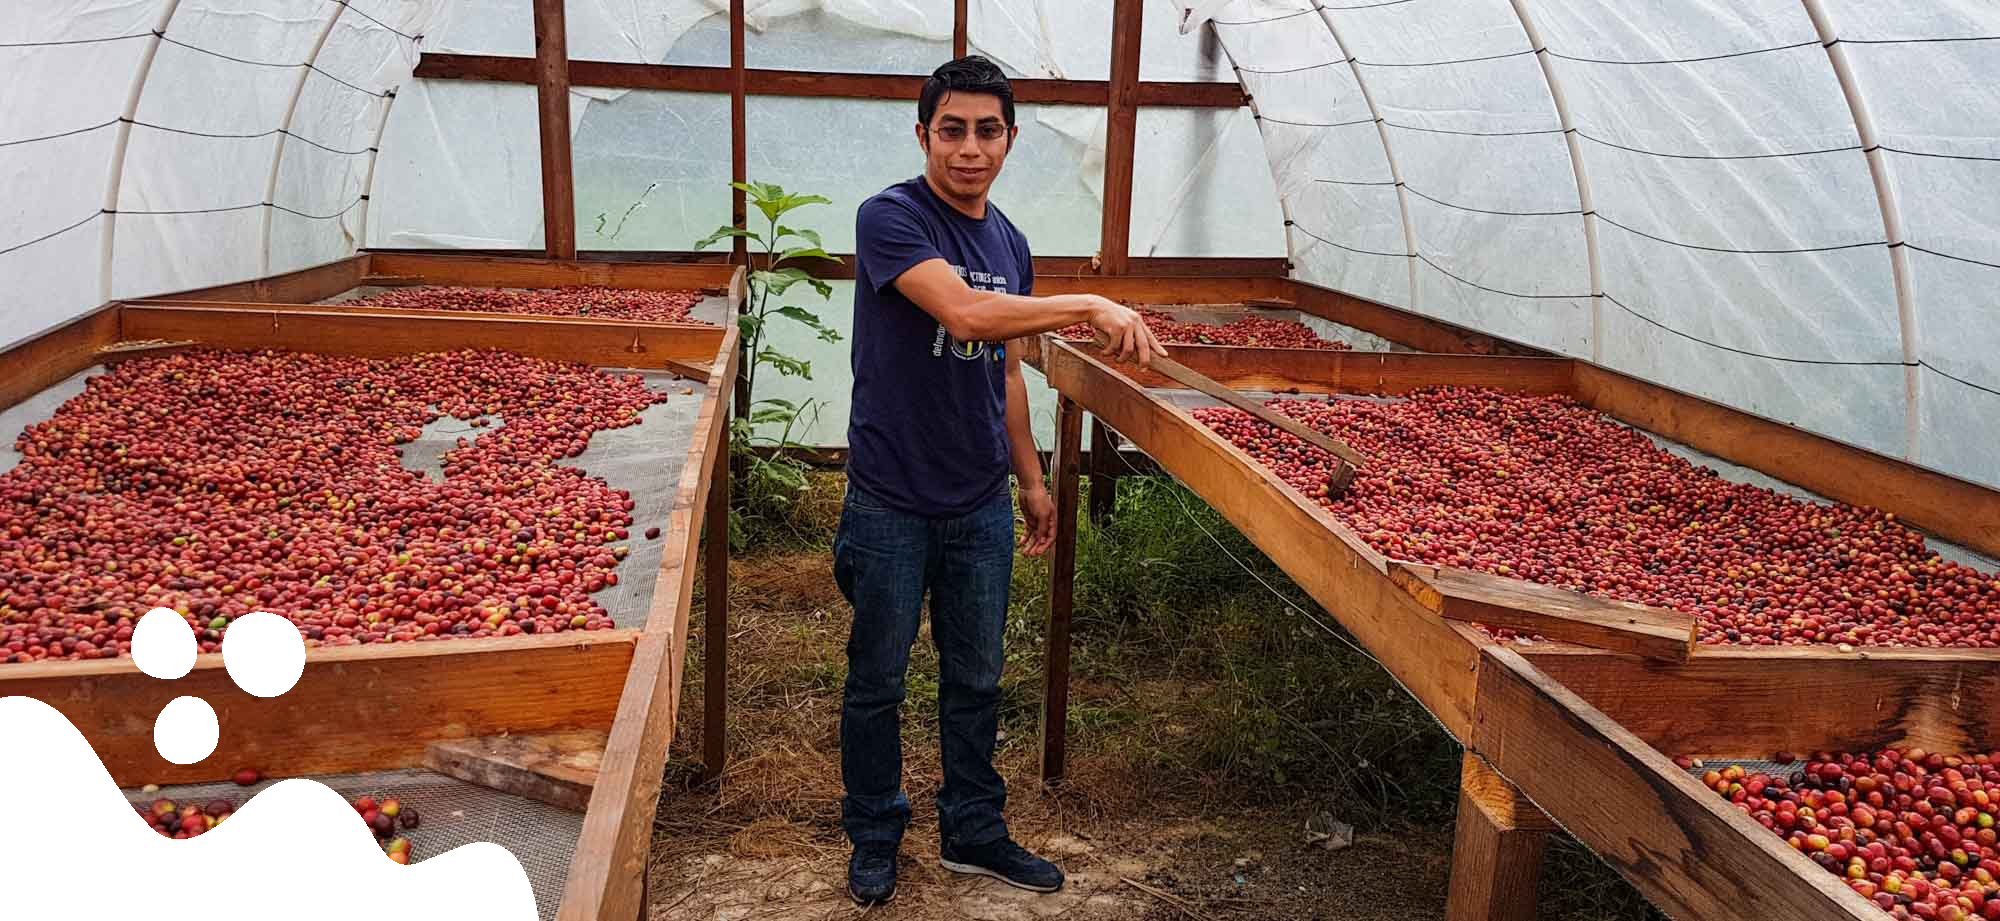
Edgar Carrillo is a dedicated coffee producer; he and his sister Karen founded the organization Pacayal Coffee in Marcala, Honduras, in 2013,...
The coffee world has evolved immensely in the last few decades, largely driven by an increase in coffee consumption, with coffee lovers...
.png "SH Logo")